
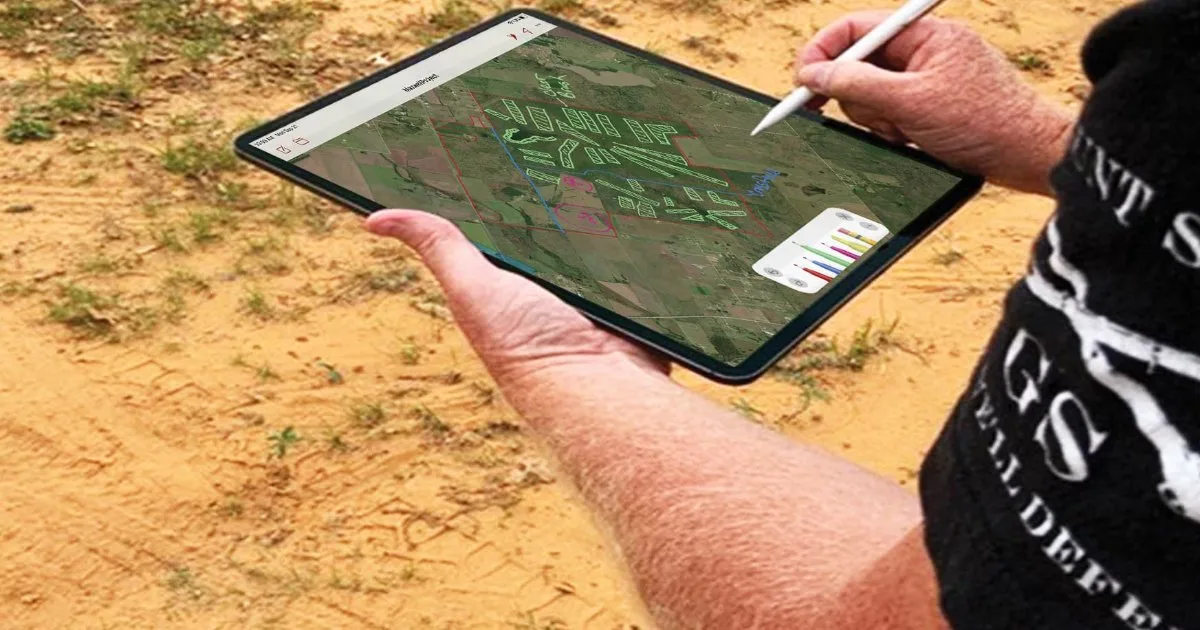

Satellite imagery has quietly become one of the most useful sources of environmental information available. Agencies and research groups have used it for decades to track forest loss, crop growth, and drought. What has changed is who can use it. Tools that once required specialist software and training are now arriving on ordinary phones and laptops, and that shift is opening up environmental research to farmers, landowners, and curious individuals. EcoPlot, an app developed by MillPont, is one example of this trend. It links satellite views of the land with on-the-ground observations, so the people who know a place best can study it in a structured way.
Why Satellite Imagery Used to Be Out of Reach
For most of its history, satellite data was technically public but practically locked away. Raw imagery arrives in large files that need processing before they mean anything. Turning pixels into useful measures, such as how much green vegetation covers a field, required geographic information systems, coding skills, and a fair amount of patience.
That left a gap. Researchers had the tools but rarely the local knowledge of what was happening on a particular farm. Farmers had the local knowledge but rarely the tools. Much of the value of satellite data was lost somewhere in between.
What Satellites Can and Cannot See
Before looking at how apps close that gap, it helps to be clear about what imagery from orbit actually shows. Satellites are very good at large patterns. They can show where vegetation is dense or sparse, how plant cover shifts through the seasons, where water collects after rain, and where tree lines, hedgerows, and wetlands sit across a landscape.
They are much weaker at detail. A satellite image will not tell you whether a green patch is a native grass or an invasive weed, whether bees are visiting a field margin, or whether the birds in a hedgerow are nesting there. Those questions need someone on the ground.
This is the central idea behind satellite ecological mapping for farms: the image gives the overview, and human observations fill in the meaning. Neither source is complete alone, but together they create a far richer picture than either could provide separately.
How the EcoPlot App Turns Imagery Into a Working Map
Selecting Boundaries Directly on the Image
The EcoPlot app starts with a satellite view of the user’s land. Instead of entering coordinates or importing files, users select their field and parcel boundaries on the map itself. Once a boundary is set, that area becomes a unit for recording information. A farm might be split into a dozen fields, a woodlot, and a pond margin, each with its own record.
This sounds simple, but it solves a real problem. Environmental research depends on knowing exactly where an observation was made. When every note, photo, and species record is tied to a mapped area, the data can be compared across seasons and years without confusion about which field was which.
Layering Observations on the Map
With boundaries in place, users add what they see. EcoPlot supports plant and wildlife observations, species identification, and bird and wildlife sound identification. A morning walk along a hedgerow can produce a short list of bird species, a few plant photos, and a note about where the ground stays wet. All of it sits on the same map as the satellite imagery.
The app also brings environmental data and land intelligence into the same view, which gives each observation more context. A sighting means more when you can see the surrounding cover, the nearby water, and the land use around it.
Research That Fits Between Daily Chores
One of the biggest obstacles to environmental research on private land is time. Farmers and ranchers are busy, and formal survey methods can feel like a second job. The advantage of an app-based approach is that research can happen in small pieces. A photo taken while checking fences, a recording made while moving cattle, or a note jotted during harvest all add up.
This is where the question of how farmers can map wildlife habitat with satellite data gets a practical answer. The satellite layer shows where habitat is likely to be, such as tree cover, field edges, and wet ground. Quick observations confirm what is actually using that habitat. Over a few seasons, a producer can build a habitat map of their property that would have taken a hired survey team weeks to produce.
Because observations are tied to locations and dates, patterns start to show. A field margin planted with wildflowers might show more bird species after two years. A wetland edge might attract new visitors once grazing pressure is reduced. These are the kinds of findings that make environmental research meaningful on a working farm.
Uses Beyond the Farm Gate
While agriculture is a natural fit, the same approach works for other kinds of land. Ecological monitoring for parks follows a similar pattern: map the area, divide it into zones, and record what lives where over time. Park staff and volunteers can use satellite views to spot changes in vegetation cover, then confirm them with field observations.
Conservation groups, schools running outdoor projects, and landowners managing land for wildlife can all benefit from the same combination. EcoPlot app also supports community collaboration and shared environmental observations, which helps when several people are contributing records to the same area.
What Researchers Gain From Landowner Records
The benefits run in both directions. University teams, conservation charities, and government agencies often struggle to get data from private land, which makes up a large share of the countryside in most regions. When landowners keep consistent, location-tagged records, they create a source of information that formal surveys rarely reach.
Related: Exploring Data Science SEO, Its Implementation, and Key Benefits
Shared observations can help researchers understand how farmland birds respond to different hedgerow management, how pollinators use field margins through the season, or how quickly invasive plants move along waterways. For landowners, contributing to that wider picture can be rewarding in itself, and it sometimes opens doors to advice, partnerships, or funding for habitat work. The key is quality. Clear locations, honest identifications, and regular repeat visits make farm records trustworthy for researchers, not just a collection of interesting but unusable notes.
Limits Worth Keeping in Mind
Satellite-linked tools are powerful, but they are not a replacement for careful fieldwork. Cloud cover can limit imagery at certain times of year. Small features like a narrow stream or a single patch of rare plants may not be visible from orbit. Species identification from photos and sounds is helpful, but tricky or uncommon species still benefit from a second opinion from an expert.
The most reliable results come from consistency. Observing the same places at similar times each year, and recording conditions like weather and recent management, makes the data far more useful than scattered one-off notes. It also helps to keep observation methods simple, so that anyone helping with the records, whether a family member, an employee, or a volunteer, collects information in the same way.
Conclusion
Satellite data has moved from specialist labs to everyday devices, and that shift is changing who gets to do environmental research. By letting users select land boundaries on satellite imagery and attach observations, species records, and sound recordings to those areas, EcoPlot connects the overview from orbit with the detail only people on the ground can provide. For farmers, park managers, and landowners, the result is a practical way to understand their land better, one observation at a time.






Leave a Reply